Human Drug Kinetics
Pharmacokinetics simulation software

Downloads

Display information in graphs
Easily review your current simulation settings at a glance using a graph, without having to spit through loads of unorganized values. The application even supports showing multiple simulations at once in the same graph for easy comparison.
Log-graphs for easy determination of rate-constants
The logarithmic y-axis provides for a very easy way of calculating slopes, since they provide a straight line. This way, you can quickly and easily calculate the elimination rate-constant and it also allows for an easy way to, for example, determine the infusion rate.
Tables containing even more detailed information
Are the graphs not precise enough or do you need specific data about various routes of elimination? Take a look at the graph, which provides detailed information about drug concentrations in the plasma, the total amount in the bloodstream and outside of the distribution volume, the uptake rate and the elimination rates through metabolization and urinary excretion.Customisable Config Files!
The only limit is your disk space
Default pre-configured drugs
By default, the application contains a sample of more than 18 pre-configured drugs, with aggregated data from multiple sources including in-vivo tests. It also contains a default configuration for simulating an average 25 y/o male weighing 70kg and measuring 183cm.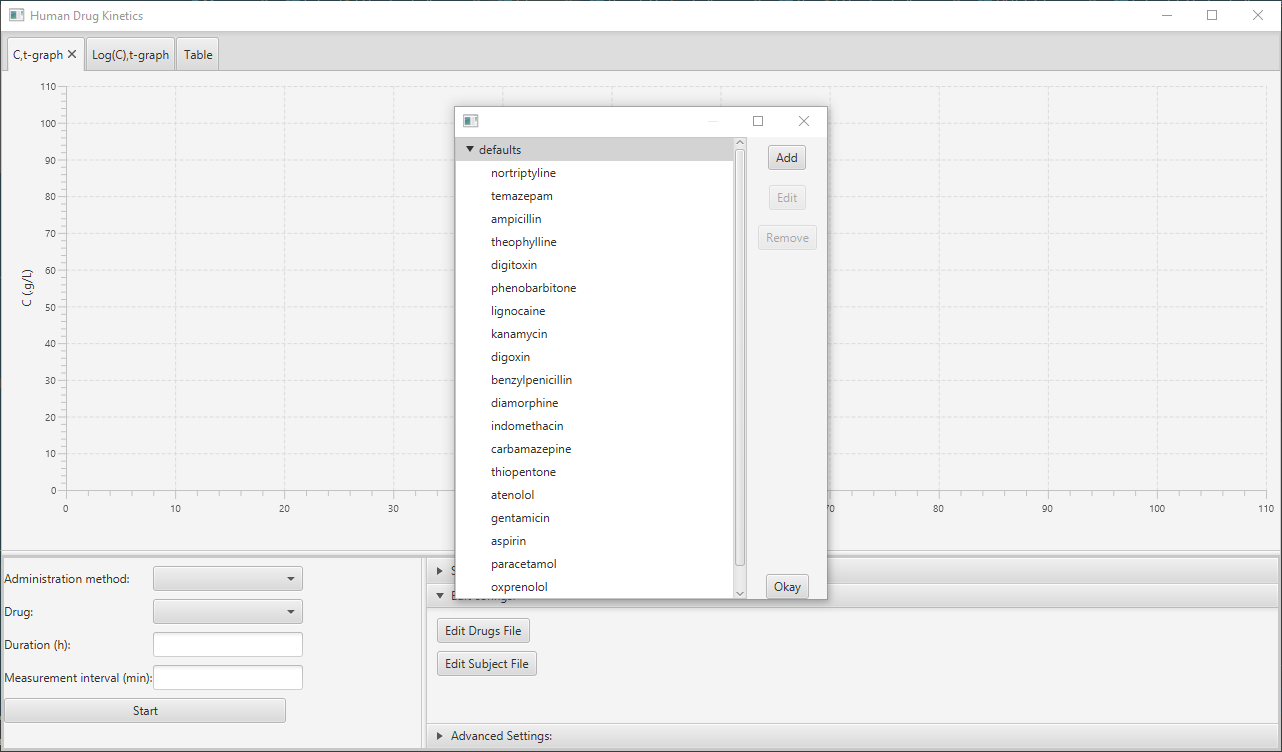
Not satisfied with the default drugs? There's room for more!
Are the more than 18 pre-configured drugs not enough or do you want to tweak the parameters? You can easily add custom drugs to the application using 21 advanced options.
Experimentation on different subjects
Curious to see what would happen when the subject's hepatic function is decreased? Or what would happen in subjects with renal insufficiency? This application allows you to edit 9 advanced properties of your subjects on the fly and even allows you to store your configuration if the results were particularly interesting.
© Luc Koenderink | 2018